Dashboard UI · SaaS · Business Analytics
MetaMetric Analytics Platform
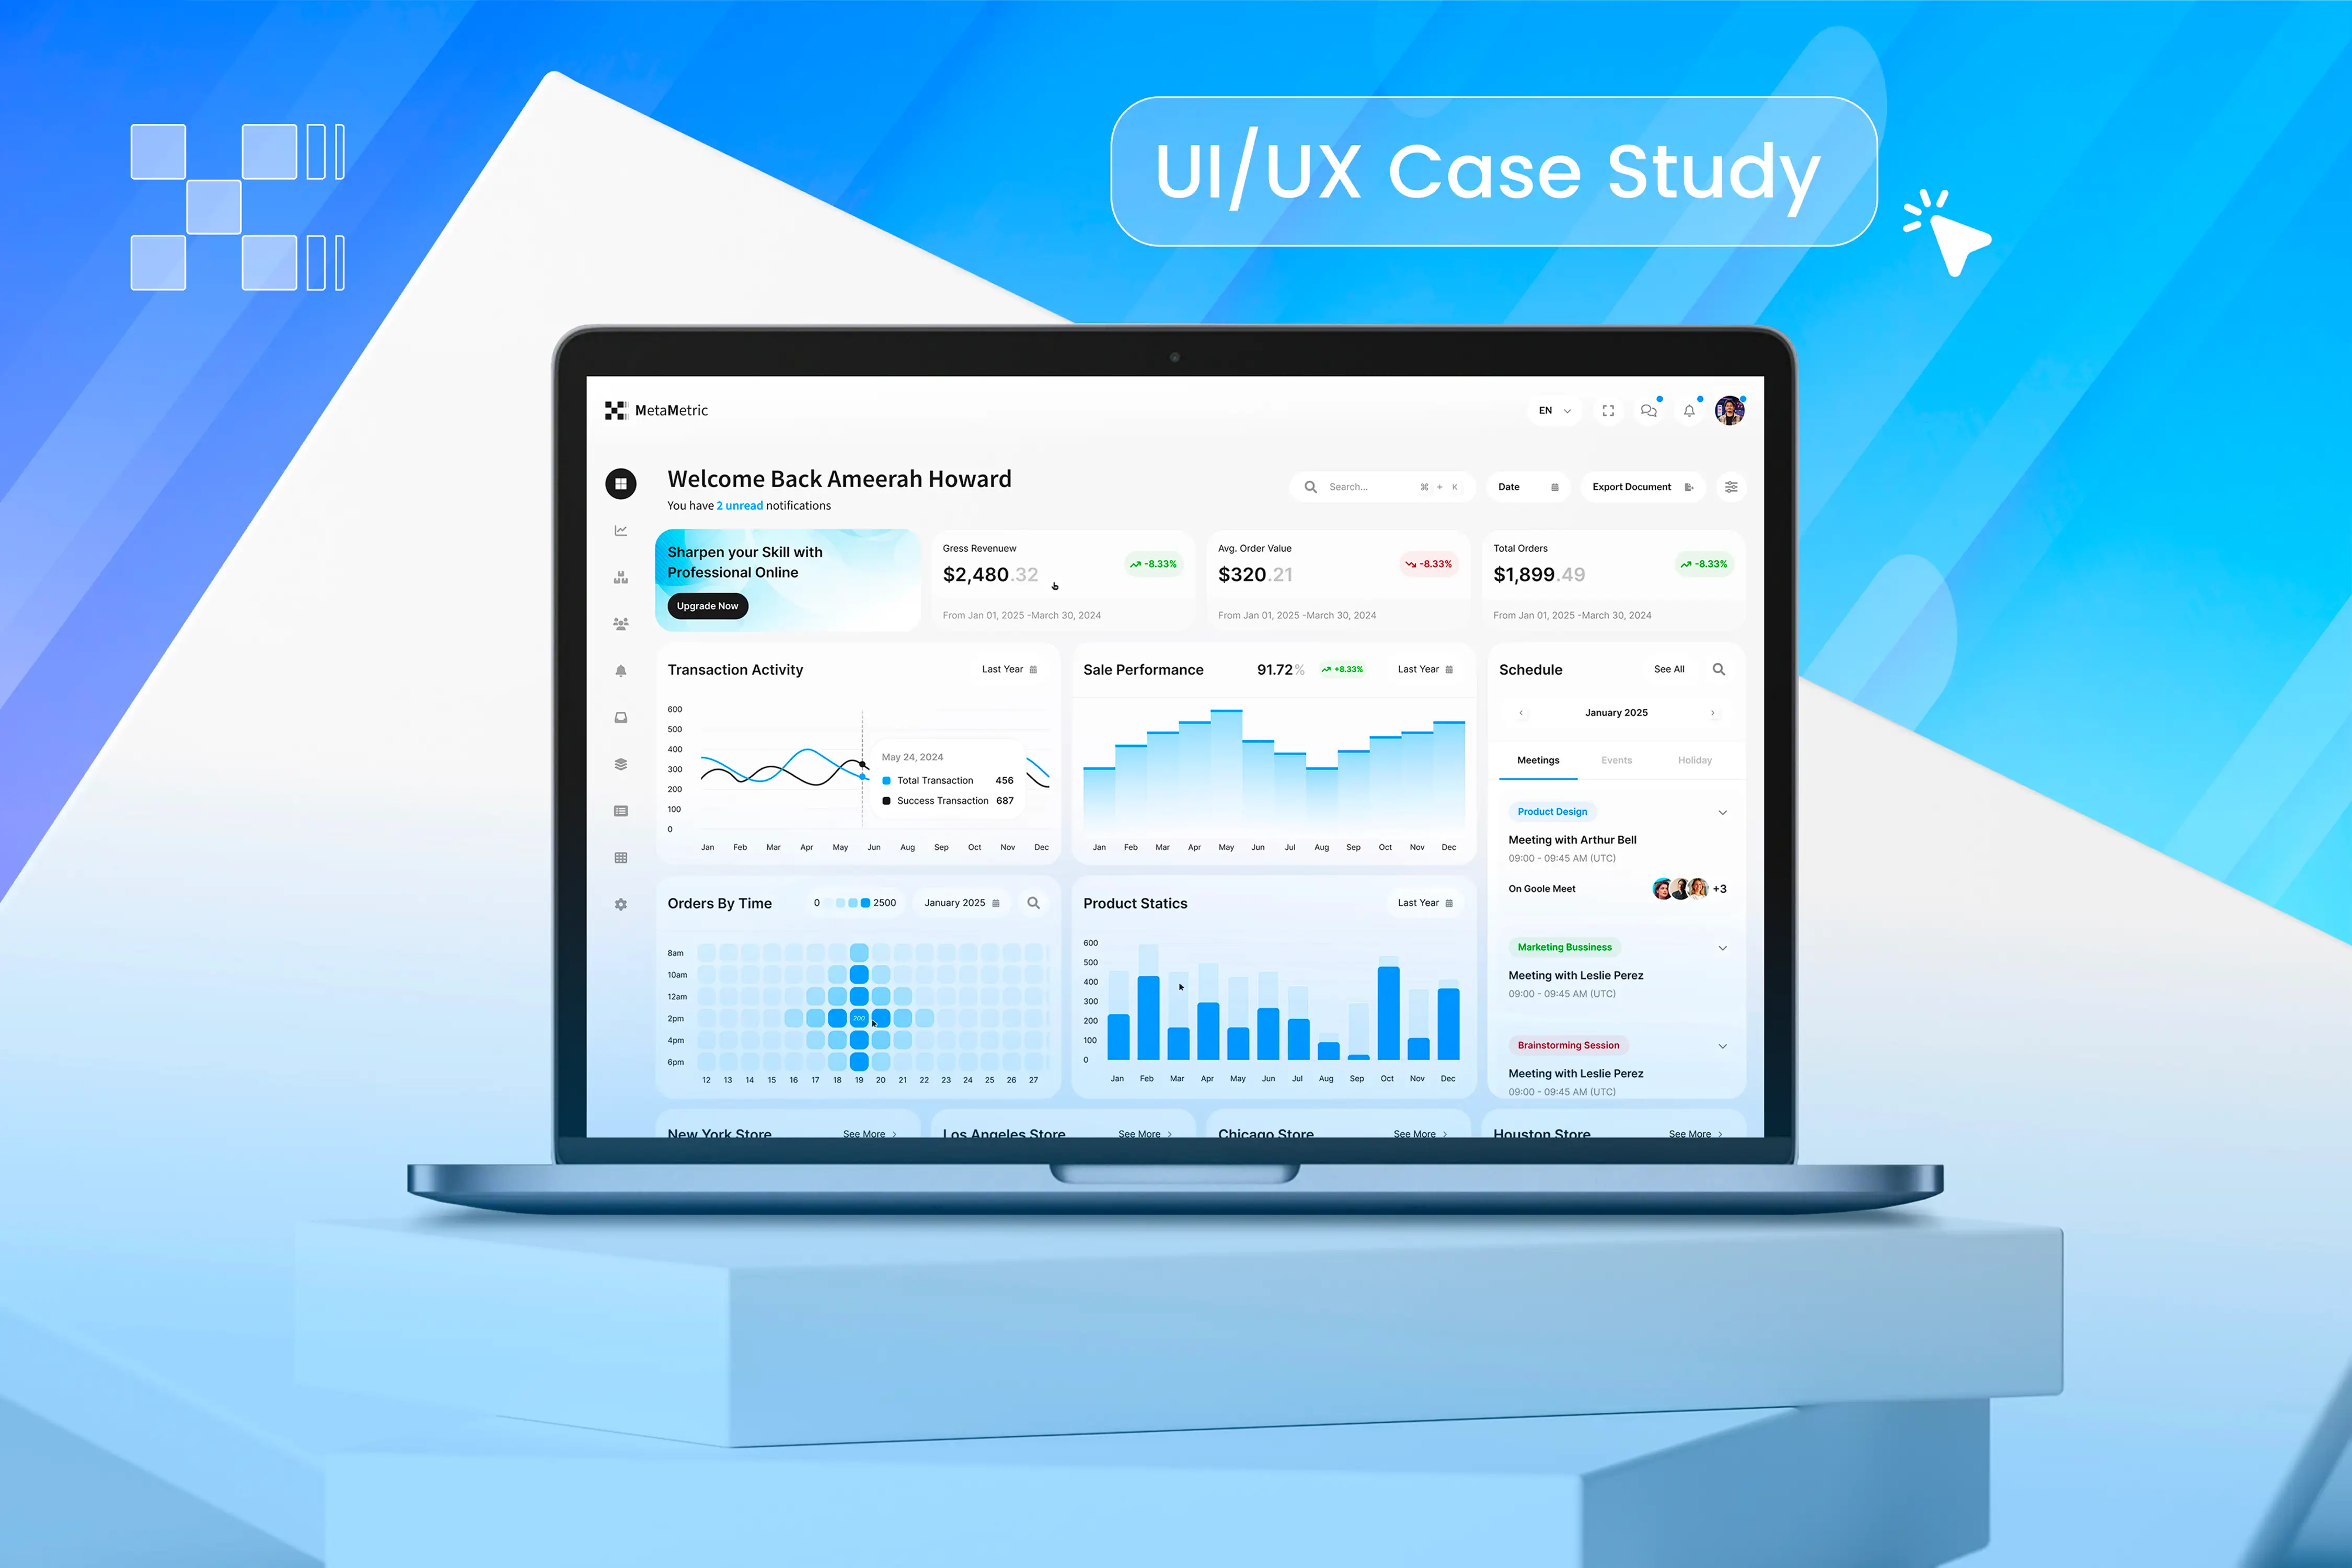
An analytics dashboard for smarter business decisions — dense data made calm, scannable, and genuinely useful for daily operators.
Overview
MetaMetric turns store and sales data into decisions. The product had powerful data underneath but the interface treated every number as equally important — so users saw everything and understood nothing.
The challenge
Analytics dashboards live or die on hierarchy. The challenge was to organize revenue, orders, transaction activity, sales performance, and scheduling into one screen a busy operator can read in ten seconds — without dumbing the data down for analysts who go deeper.
The approach
- Defined a strict KPI hierarchy: headline metrics first, trends second, breakdowns on demand.
- Designed calm, light-surface data cards with one clear visual per card — line, bar, or heatmap — instead of chart soup.
- Added an integrated schedule panel so meetings and business reviews live next to the numbers they discuss.
- Built the whole screen from a reusable component library with consistent spacing, states, and chart styles.
The outcome
A dashboard that reads top-to-bottom like a briefing: what happened, what's trending, what needs attention. The component library keeps new modules consistent as the product grows, and the file handed off clean to the development team.
The thinking behind this work: the 12 principles I use on every data product — or see what a project like this costs.
Next project
Aventurova →